
반응형
Notice
Recent Posts
Recent Comments
Link
| 일 | 월 | 화 | 수 | 목 | 금 | 토 |
|---|---|---|---|---|---|---|
| 1 | 2 | 3 | ||||
| 4 | 5 | 6 | 7 | 8 | 9 | 10 |
| 11 | 12 | 13 | 14 | 15 | 16 | 17 |
| 18 | 19 | 20 | 21 | 22 | 23 | 24 |
| 25 | 26 | 27 | 28 | 29 | 30 | 31 |
Tags
- 집 값 예측 분석
- 프로그래머스
- 브라우저 실행
- 다익스트라 알고리즘
- 참조 변수
- matplotlib
- 2BPerfect
- 순열
- 타입 변수
- jdbc
- 박스그래프
- 점프 투 파이썬
- Do it
- 팩토리얼 진법
- java
- BFS
- MacOS
- np.zeros_like
- dacon
- 이것이 취업을 위한 코딩테스트다
- mysql
- Extended Slices
- 자바
- 습작
- PYTHON
- 백준
- sql
- DFS
- Do_it
- 이진수 변환
Archives
- Today
- Total
🦕 공룡이 되자!
Dacon 와인 품질 경진대회...3 본문
fig, axes = plt.subplots(4, 3, figsize=(25, 15))

fig.suptitle('feature distributions per quality', fontsize= 40)
for ax, col in zip(axes.flat, train.columns[1:]):
    sns.violinplot(x= 'quality', y= col, ax=ax, data=train)
    ax.set_title(col, fontsize=20)
plt.tight_layout()
plt.show()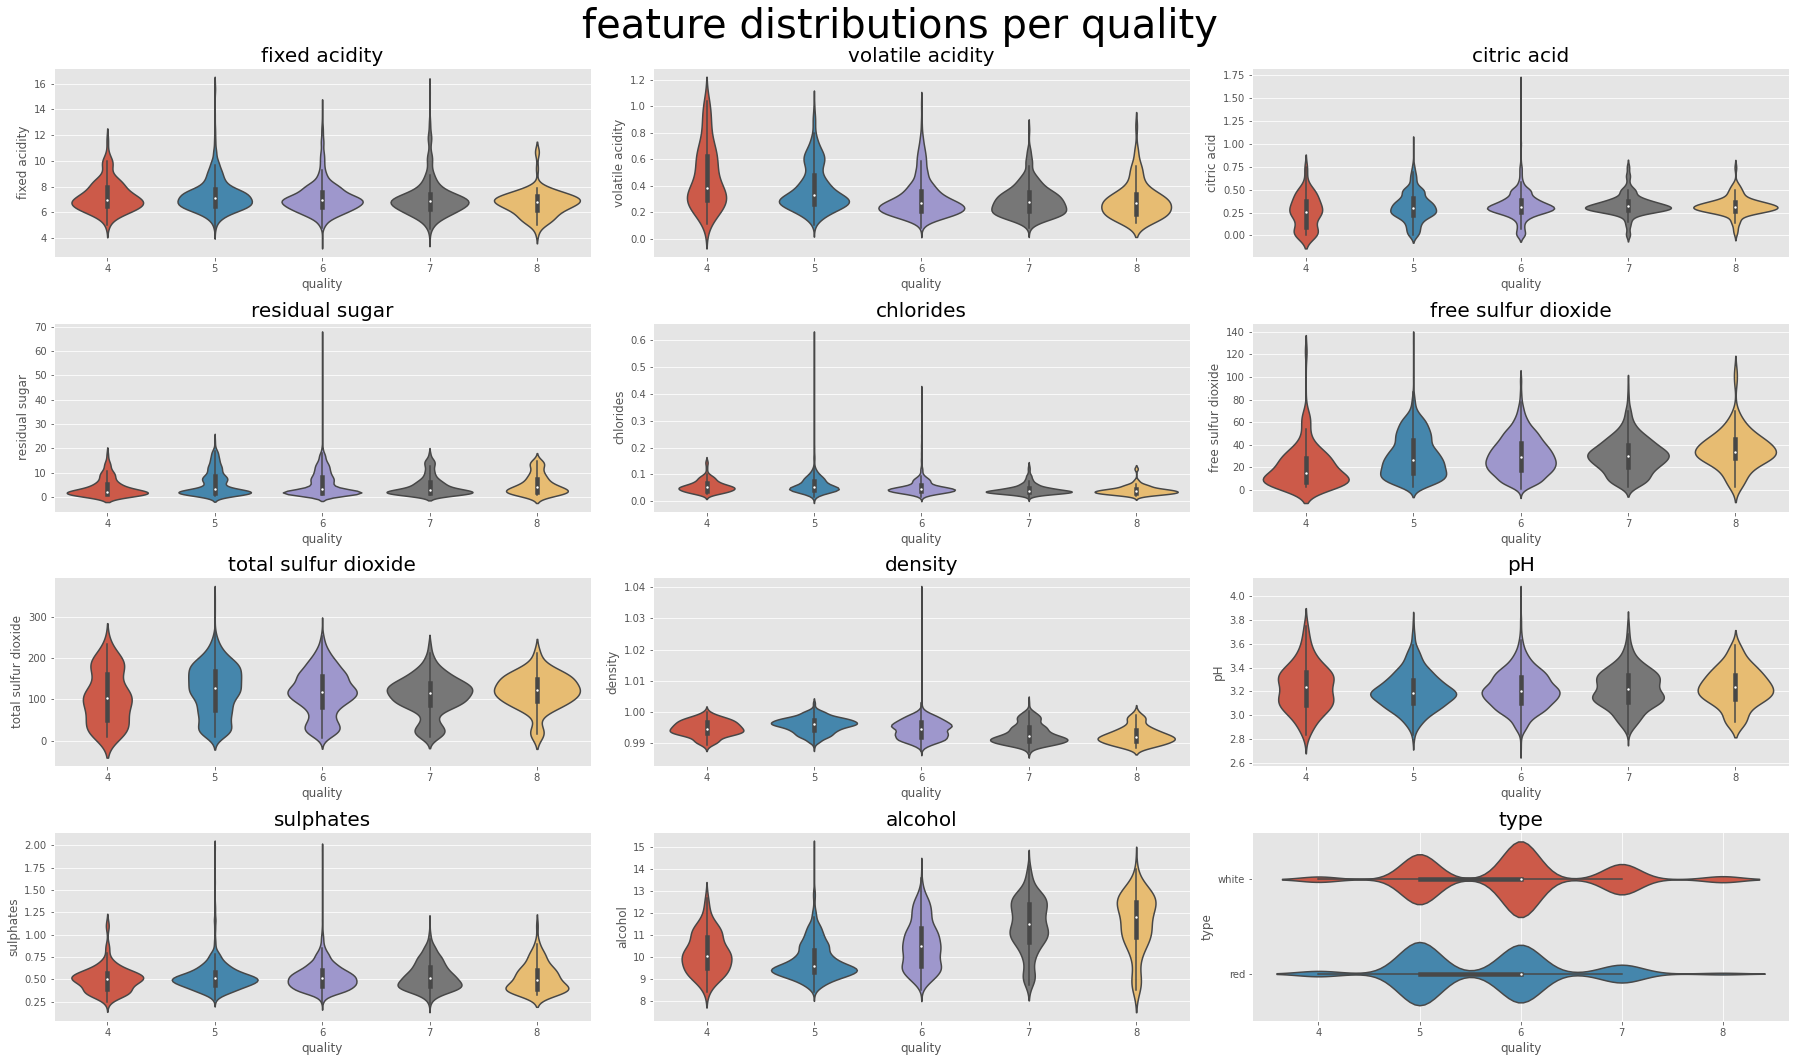
sns.color_palette("Set2")
fig, (ax1, ax2, ax3) = plt.subplots(1, 3, figsize = (30, 9))


scatter_fix = sns.histplot(data=train, x='pH', y='fixed acidity', bins=50, ax= ax1)
scatter_volatile =  sns.histplot(data=train, x='pH', y='volatile acidity', bins=50, ax= ax2, hue='quality')
scatter_citric = sns.histplot(data=train, x='pH', y='citric acid', bins=50, ax=ax3, hue='quality')
scatter_fix.set_xlabel('pH', fontsize=20)

ax1.settitle()
fig.suptitle('pH & acid hist plot', fontsize = 40)

plt.show()
상관관계
plt.figure(figsize=(20,10))

heat_table = train.drop(['id'], axis=1).corr()
heatmap_ax = sns.heatmap(heat_table, annot=True, cmap='coolwarm')
heatmap_ax.set_xticklabels(heatmap_ax.get_xticklabels(), fontsize=15, rotation=45)
heatmap_ax.set_yticklabels(heatmap_ax.get_yticklabels(), fontsize=15)
plt.title('correlation between Wine features', fontsize=40)
plt.show()
fig, axes = plt.subplots(1, 2, figsize=(2.33 * 10, 1 * 10))

for i, ax in enumerate(axes):
    if i == 0:
        sns.histplot(x= 'free sulfur dioxide', y= 'total sulfur dioxide', ax= ax, hue= 'quality',data= train)
    else:
        sns.histplot(x= 'free sulfur dioxide', y= 'total sulfur dioxide', ax= ax, hue= 'type',data= train)

axes[0].set_title('divided with quality', fontsize=20)
axes[1].set_title('divided with type', fontsize=20)
fig.suptitle('total & free sulfur dioxide hist plot', fontsize= 40)
plt.show()
fig, axes = plt.subplots(1, 2, figsize=(2.33 * 10, 1 * 10))

for i, ax in enumerate(axes):
    if i == 0:
        sns.histplot(x= 'density', y= 'alcohol', ax= ax, hue= 'quality',data= train)
    else:
        sns.histplot(x= 'density', y= 'alcohol', ax= ax, hue= 'type',data= train)

axes[0].set_title('divided with quality', fontsize=20)
axes[1].set_title('divided with type', fontsize=20)
fig.suptitle('density & alcohol hist plot', fontsize= 40)
plt.show()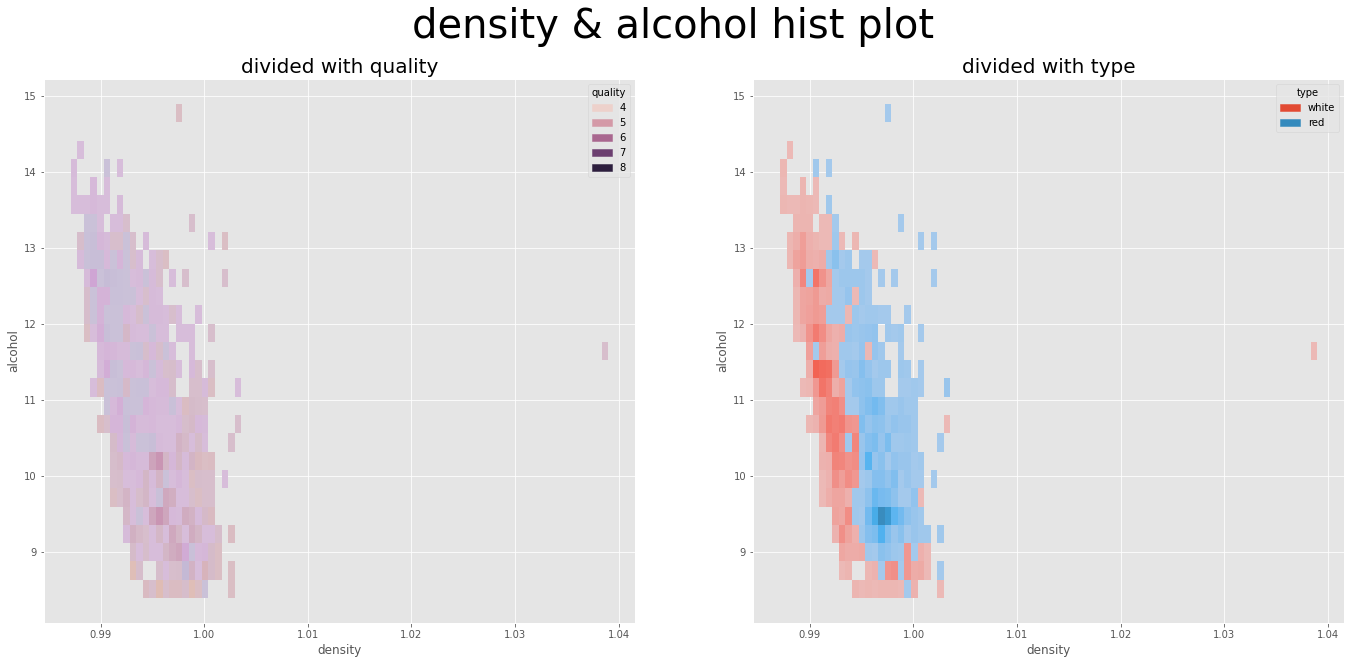
fig, axes = plt.subplots(1, 2, figsize=(2.33 * 10, 1 * 10))

for i, ax in enumerate(axes):
    if i == 0:
        sns.histplot(x= 'density', y= 'alcohol', bins=50, ax= ax, hue= 'quality',data= train)
        ax.add_patch(patches.Ellipse((1.0385, 11.7), .001, .5, color='r', fill=False))
    else:
        sns.histplot(x= 'density', y= 'alcohol', bins=50, ax= ax, hue= 'type',data= train)
        ax.add_patch(patches.Ellipse((1.0385, 11.7), .001, .5, color='r', fill=False))

axes[0].set_title('divided with quality', fontsize=20)
axes[1].set_title('divided with type', fontsize=20)
fig.suptitle('density & alcohol hist plot', fontsize= 40)
plt.show()
반응형
'Data > Dacon' 카테고리의 다른 글
| 집 값 예측 분석...3 (0) | 2022.02.08 |
|---|---|
| 집 값 예측 분석...2 (0) | 2022.02.08 |
| 집 값 예측 분석...1 (0) | 2022.02.03 |
| Dacon 와인품질 경진대회...2 (0) | 2021.12.07 |
| Dacon 와인 품질 경진대회 (0) | 2021.12.06 |
'Data/Dacon' Related Articles
more


Comments